Understanding your insights
The dashboard that shows how your business is really doing.
What it is
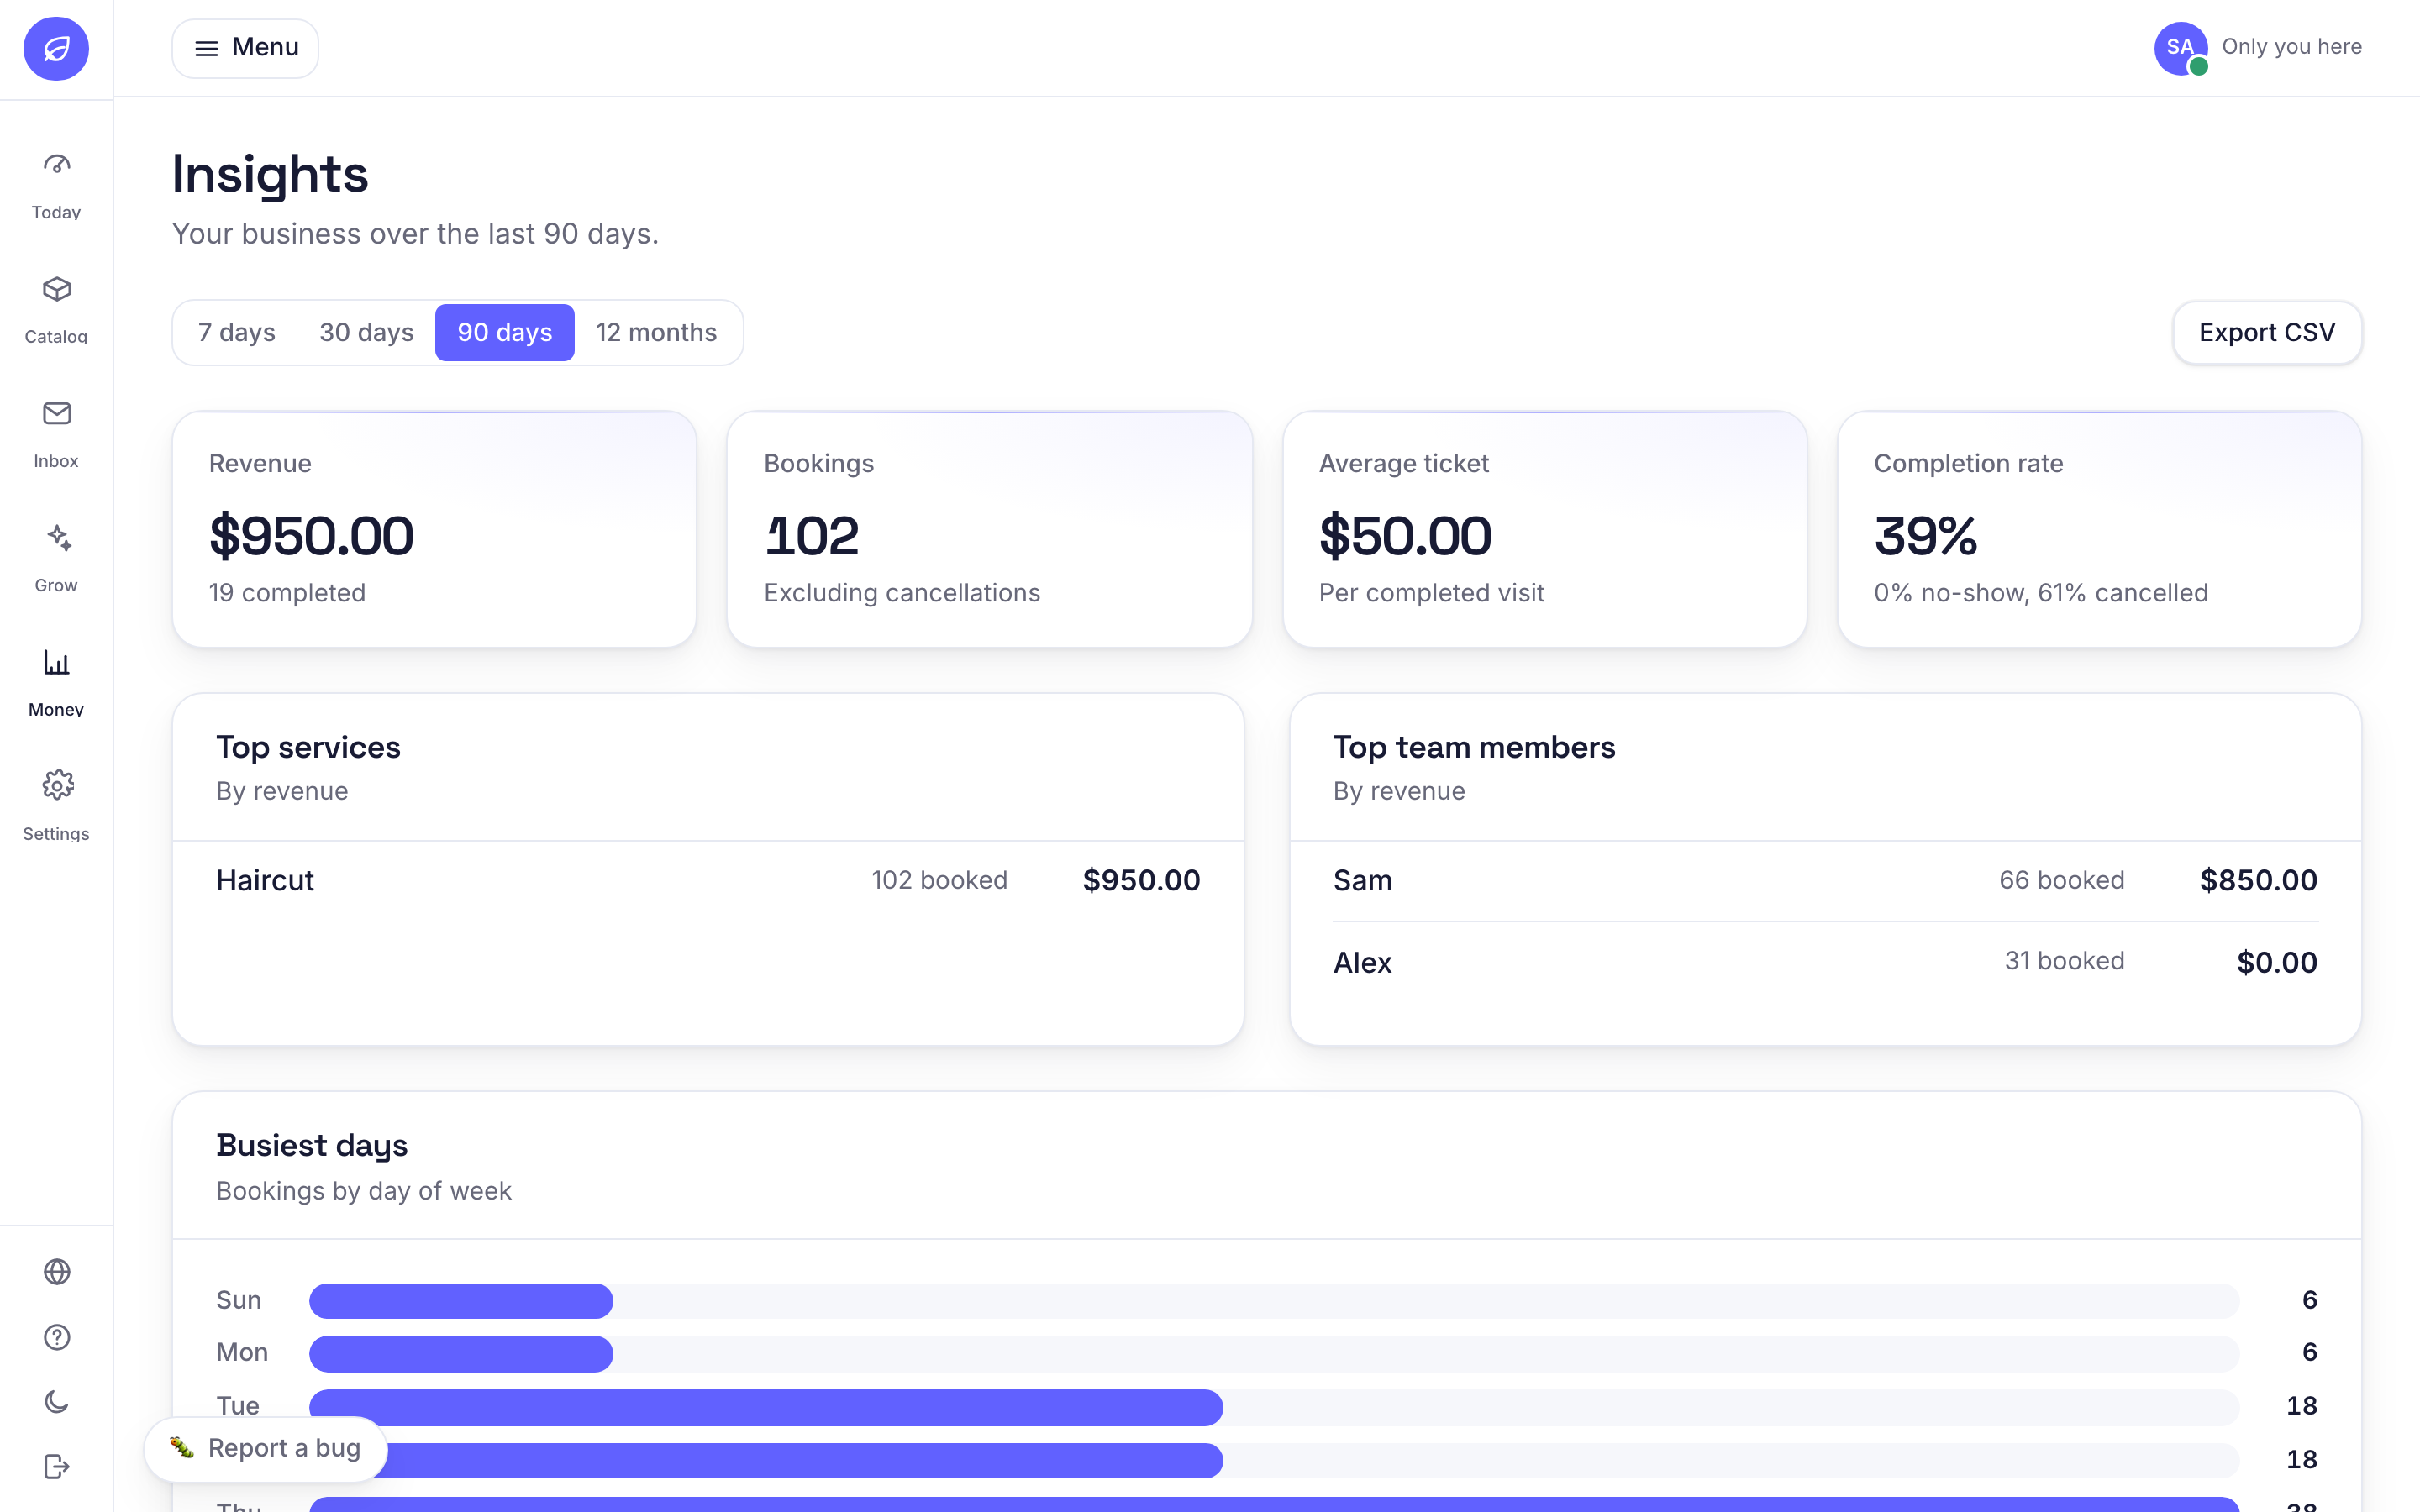
A plain-English view of your numbers: how much you have earned, how many bookings you have had, your busiest times, your most popular services, and how many clients are coming back. It updates as bookings come in.
Why it helps
You make better calls when you can see the picture. Spot your quiet days, your best sellers and whether clients are returning, then act on it.
How to use it
- 1Open Insights to see your earnings and bookings over a period you choose.
- 2Look at top services and busy times to plan your week and your staffing.
- 3Watch new versus returning clients to see if your marketing is working.
- 4Pair it with Retention to win back clients who have drifted.
Related guides
Was this helpful?
Didn’t find what you need?
Contact support or browse the FAQ.